
Featured Case Study:
Plant Health Assessment
What is Multi-Spectral imaging?
We all know that plants photosynthesize to produce their own energy, and we know that they do so by absorbing light from the sun. In essence, the more light a plant is absorbing, the more energy it is producing. This technology works by measuring how much light is reflected back from the plant and at what wavelengths.
What does that tell us?
By measuring the wavelengths we can tell quite a bit about plant health:
vegetation density
chlorophyll concentration
changes in relative light absorption (indication of stress)
plant vigor
Some wavelengths even penetrate through foliage better than others, allowing us to see deeper into a plant canopy rather than just the surface.
What does it look like?
Here are some sample images from a past crop analysis:
KO Drones was contacted by a farmer who was working with a newly developed field of organic grain. Since this plot had not been in cultivation for several years, they had done very little testing and were in the design phase of their soil development program. The request was to do an analysis on a part of the field that had poor stand development to determine if this area could be profitable, or if it should be abandoned to non-production. In the current climate of low grain prices and high input costs, every acre matters. And to this farmer who averages working 95-100 hours/week - every minute that he can spend with his family instead of out in the field is priceless.
Our goal was relatively simple:
identify several key areas for soil testing
notate areas of the field that might not be worth harvesting
document current production levels to track the effectiveness of his management program over time
Here is a sample of what KO Drones provided for this landowner:
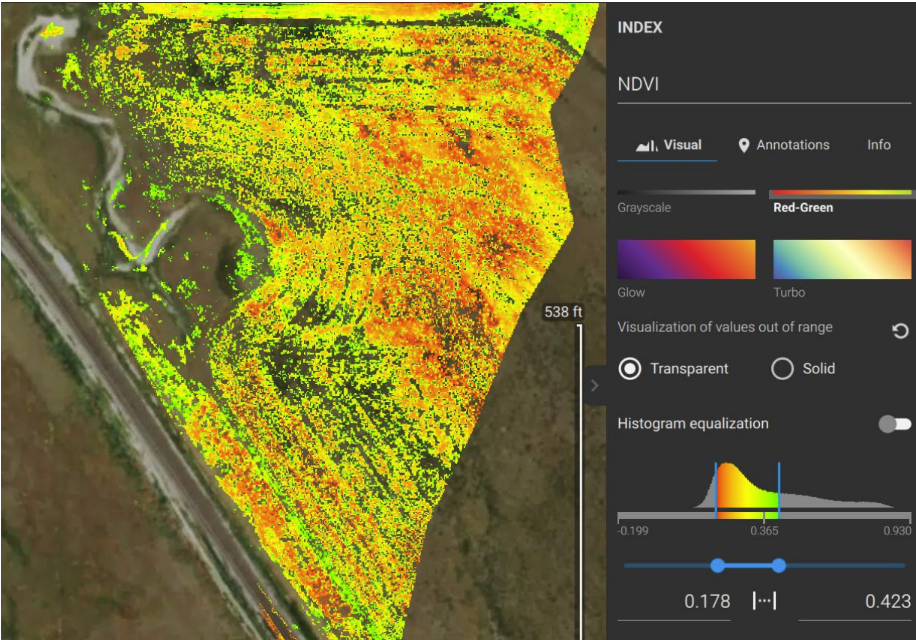
NDVI overview
NDVI quantifies vegetation health and density by measuring the difference between visible red light and near-infrared light reflectance. Healthy vegetation absorbs more red light and reflects more near-infrared light.
Overshoot footage of an adjacent harvested field was used to add contrast between vegetation and soil. The upper limit was set to exclude the still green weeds within the field. Therefore, lit areas only include crop images with green representing the areas that likely still contain moisture and the red areas representing grain that is fully mature.
Areas without color should be assumed not to contain harvestable material.
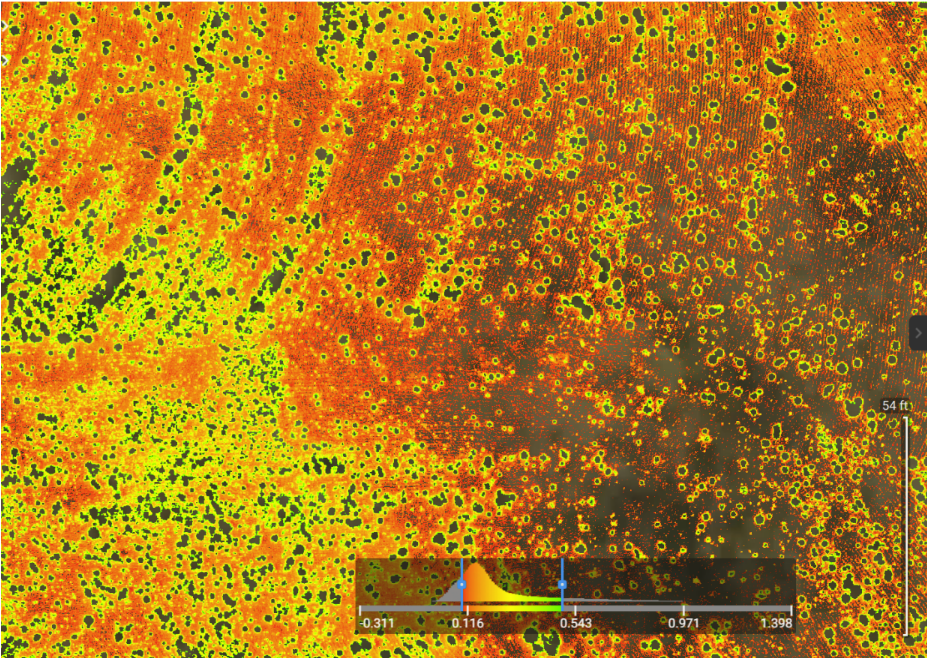
MCARI - A Closer Look
MCARI - estimates chlorophyll content in plants and is designed to help clarify an image by reducing the effect of soil and background reflectance. It is also more resistant to illumination effects (changes in sunlight) and soil reflectance than other imaging. This reduces the effect of changes in light reflection as cloud shadows move across a field during image capture.
Higher MCARI values generally indicate lower chlorophyll content, but this is to be expected in the case of ripened grains ready to harvest.
While this imaging is best used to see changes over time, MCARI can be helpful in getting a good view of approximate vegetation density in a field.
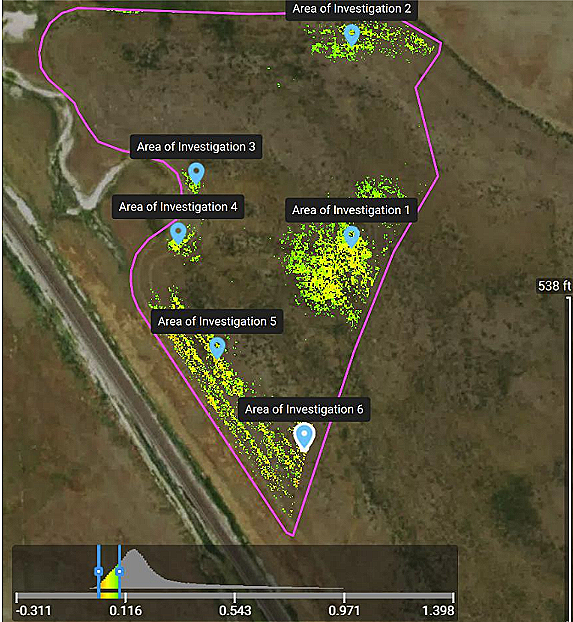
MCARI - A Different Perspective
MCARI - can also be used to filter out vegetation and highlight areas of exposed soil.
Our analysis has determined 6 potential areas of investigation where there appears to be a low stand despite a lack of apparent weed pressure. Coordinates were sent to the landowner so that he could pull plant tissue and soil samples for further investigation. situations like this may arise due to adverse alkalinity, poor nutrient density, or other factors. Targeted treatments can allow for improved yields with decreased inputs.